LA2050 Blog
We’ve got access to the information that every Angeleno needs to make an impact. Our blog features the latest LA2050 news, announcements, features, happenings, grantee updates, and more.

Trends in the 2020 My LA2050 Grants Challenge
PostedIn this year's My LA2050 Grants Challenge, we received 285 proposals to make LA the best place to LIVE, LEARN, PLAY, CONNECT, and CREATE. We saw so many unique proposals working on every issue imaginable - civic engagement, food systems and sustainability, criminal justice reform, obesity, mental health, diversity in media, film, and television, homelessness, COVID-19 relief, and many more. If you didn't catch our last few blogs, we recapped trends in the proposals from each goal category: LIVE, LEARN, PLAY, CONNECT, and CREATE.
This week, we announced the 25 finalists in the My LA2050 Grants Challenge. Each of the finalist proposals will be up for a vote June 8th through June 15th. The results of voting will determine the size of the grant that each organization receives. But before we get to voting, here's some of the data we've gleaned from proposals to this year's grants challenge.
Types of Organizations
We're thrilled to have received 130+ more proposals than last year's grants challenge. We're grateful to every organization that participated in this year's challenge, especially given the uncertainty in our world. Of the 285 proposals we received in the challenge, 80 percent were from nonprofit organizations. About nine percent of proposals came from for-profit organizations, and another nine percent came from fiscally sponsored groups. We received five proposals from social enterprises or B-corps and three proposals from government entities. 60 percent of applicants had never applied to the grants challenge before.
Organization Size
A majority of organizations that applied to the grants challenge are on the smaller side in terms of staff with 70 percent of organizations reporting fewer than 20 employees. 43 percent of applicants are even smaller, reporting between zero and five employees. But, when it comes to organizational budgets, there was more of a range with 58 percent of applicants reporting annual operating budgets under $1 million. Of those organizations, 18 percent reported budgets in the range of $100,000 - $500,000. 42 percent of applicants have budgets greater than $1 million.
Type of Proposal
72 percent of applicants to the challenge sought funding to expand an existing program at their organization. 20 percent of proposals were seeking funding for a pilot program, and six percent were looking to fund the lateral application of a solution to a new issue area. Only one percent of proposals were seeking funding for research projects.
Regional Impact
We asked all 285 applicants to indicate which communities they would reach with their proposals. Applicants were given the option to select more than one geographic area or to select an overarching region — Los Angeles County, the City of Los Angeles, or the LAUSD. Nearly half of all proposals selected all of Los Angeles County, 38 percent of proposals selected South LA as a focus of their work, 32 percent selected Central LA, and 27 percent selected East LA.
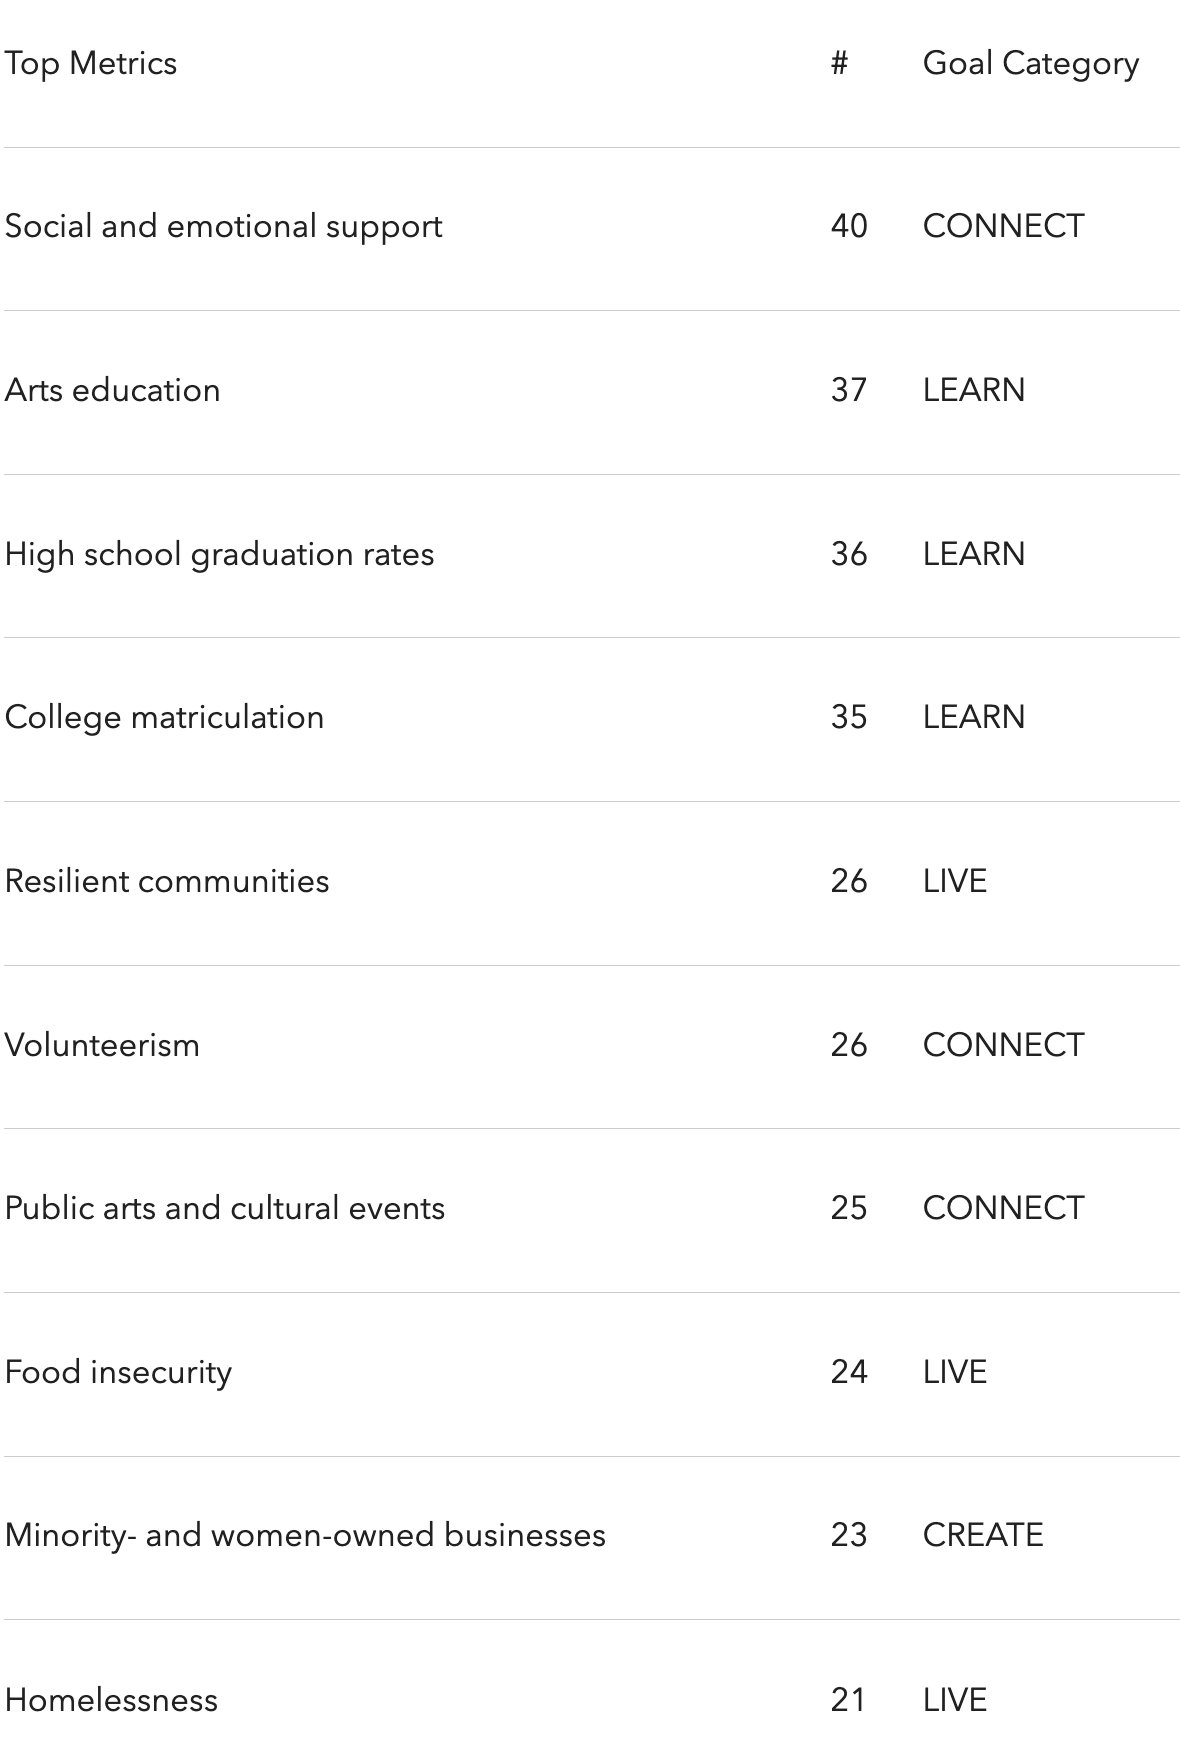
Impact Area and Metrics
In order of popularity, the most commonly selected metrics across goal categories were:
Next Steps
Starting on June 8th, it's up to YOU to choose which organizations win funding for their projects. Just pick your favorite project from each category, login, and vote. The organization with the most votes in each category wins $100,000 to implement their project, second place wins $50,000, third place wins $25,000, fourth place wins $15,000, and fifth place takes home $10,000. We are excited to see your picks!